The Cash Balance capital preservation guarantee: quantitative analysis
This is the second article on the capital preservation guarantee (hereafter referred to as the ‘floor’) applicable to cash balance plans that use a ‘market-based’ interest crediting rate (we call such a plan a ReDefined Benefit (ReDB®) plan®). In our first article we discussed how the ‘floor’ works, the challenges it presents, and different design alternatives that may address those challenges.
Other than the floor, ReDB® plans operate a lot like DC plans. The question we explore in this article is: how does the floor affect outcomes for sponsors under a ReDB® plan compared with the simpler DC design?
Methodology
On the surface, the floor looks simple, but its operation is complex. Consequently, the analysis that follows is very dense.
Our analysis is based on an example plan with a 5% annual pay credit earned at year-end and contributed, interest credits based on trust earnings, annual pay increases of 3% plus inflation, and a 3-year cliff vesting schedule. We look at the hypothetical cost of the floor over the period 1950-2013 for different stock/bond asset allocations for participants entering/exiting the plan over that period (with each entry/exit combination constituting a discrete ‘event’), assuming benefits are paid as lump sums at termination.
While this approach will not cover every conceivable outcome, the historical record captures a wide variety of economic scenarios and provides a robust stress test of floor risk.
Asset returns reflect the actual performance of an annually rebalanced portfolio comprised of the S&P 500 Index and 10-year US Treasury Bonds. No expenses are assumed. The S&P 500 return reflects the impact of reinvested dividends, and the bond portfolio is modeled using the approach described in our 2012 article Plain talk about cash balance plans.
As we discussed in our previous article, the likelihood of ‘floor events’ – participants terminating when the floor is greater than the account balance – declines as an employee’s years of service increase. Our analysis shows that, since 1950, no ‘floor events��’ have occurred for employees with 15 or more years of service, regardless of portfolio (i.e. 100% stocks, 100% bonds, and everything in-between.) Therefore, our analysis focuses on exits between 3 (because of vesting) and 15 years of service.
We have prepared a six-page exhibit which provides quantitative analysis of the cost and risks of the floor under six different asset allocation strategies (100% stock, 80/20, 60/40, 40/60, 20/80, and 100% bonds.) For each allocation, the analysis considers 741 ‘events’ (distinct entry/exit combinations) over the period 1950-2013, with ‘floor events’ under each asset mix shaded red and summarized at the bottom of each exhibit.
Employer perspective
The budget for a DC plan is generally understood as a percent of payroll – a plan that provides a benefit of 5% of pay costs 5% of payroll (actually a bit less due to non-vested forfeitures.) The same is true for a ReDB® plan, except that when a ‘floor event’ occurs, the employer suffers a loss that increases plan costs.
The most straightforward way of dealing with a ReDB® floor event is for the employer to fund the difference between plan assets and the (higher) floor benefit at the time the benefit is paid. Therefore, for purposes of this article, we express the floor event as an additional contribution as a percent of pay at termination of employment.
Observations
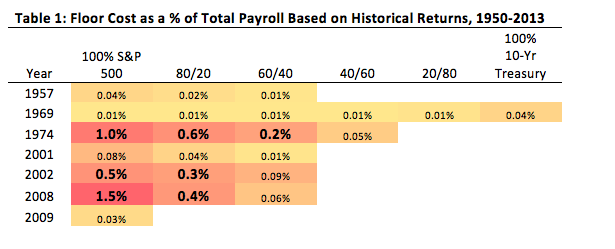
For a generic 60/40 portfolio, employers have experienced one material floor risk in the past 63 years – 1974, which cost 0.2% of total payroll for our 5% of pay plan.
For more aggressive portfolios the cost can be somewhat higher – the ‘worst case’ cost historically was 1.5% of total payroll in 2008 for a 100% stock portfolio.
For more conservative (40/60 or less) portfolios, employers have not seen a material floor risk in any year since 1950. Interestingly, the ‘least risky’ portfolio is 20/80, not 100% bonds, which speaks to the benefit of asset diversification.
Our conclusion is based on an analysis of ‘worst case’ results for the period and conservative assumptions about the general employee/participant population in which those ‘worst case’ results occur. The remainder of this article describes the analysis in greater detail.
The analysis in brief
Table 1 translates the floor cost for individual employees to estimated costs as a percent of total payroll for a typical employer over the 63 years under consideration, based on a full spectrum of possible asset allocations.
To produce these numbers we have made three generalizing assumptions:
1. We assume a uniform total payroll among employees with between 3 and 15 years of service. So, for instance, the payroll for employees with 5 years of service is the same as the payroll for employees with 10 years of service.
2. We assume the payroll for employees between 3 and 15 years of service equals 60% of total payroll. So our calculations include the 40% of the population – employees with less than 3 or more than 15 years of service – that in the period 1950-2013 never experienced a floor event.
3. We assume 50% employee turnover upon floor events. That is, in those years in which there are floor events (e.g., 2008) half the employee population terminates and may be eligible for a guarantee payment. (For most companies this assumption probably overstates turnover; for some very cyclical companies it may understate it.)

Problem years
The table above focuses on the ‘problem years’ – the 7 years out of the past 63 years in which there are floor events – and ignores the 56 years where plans suffered no material floor events under any portfolios.
Understanding what happened – what affected the floor – in these years gives some insight into what might trigger, and what might affect the cost of, such an event in the future:
1957: S&P 500 lost 12%, producing very small floor events for stock-heavy portfolios.
1969: S&P 500 lost 8%, bonds lost 5% (10-year Treasury increased from 6.0% to 7.8%), producing very small floor events for all portfolios.
1974: S&P 500 lost 26% (after losing 14% in 1973 – largest two-year drop since 1950), bonds earned less than 4% in 1973-1974 as 10-year Treasury increased from 6.5% to 7.5%, producing material floor events for stock-heavy portfolios.
2001: S&P 500 lost 12% (after losing 9% in 2000), producing very small floor events for stock-heavy portfolios.
2002: S&P 500 lost 22% (after losing 12% in 2001 and 9% in 2000 – largest three-year drop since 1950), producing material floor events for stock-heavy portfolios.
2008: S&P 500 lost 37% (largest one-year drop since 1950), producing material floor events for stock-heavy portfolios.
2009: Spillover from 2008 produces very small floor event for 100% stock portfolio only.
Worst case
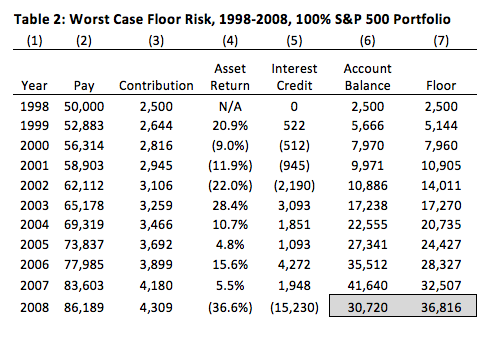
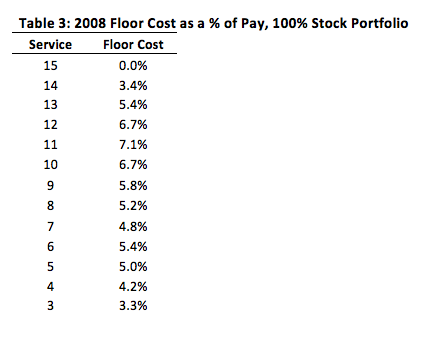
From Table 1, the ‘worst case’ outcome (1.5% of total payroll) was in 2008 under a 100% stock portfolio. All employees terminating with between 3 and 14 years of service in this scenario produced floor events, with the largest cost registering for an employee with 11 years of service (7.1% of pay.)
Table 2 provides detail for this ‘worst’ worst case result (based on starting pay of $50,000):

The shortfall in this example is $6,096 [$36,816-$30,720], or 7.1% of 2008 pay ($86,169).
Now, unless all employees are hired at the beginning of 1998 and all employees terminate at the end of 2008, the total cost as a percent of total payroll will be much less than this. Table 3 summarizes the 2008 floor cost under the 100% stock portfolio for all employees with between 3 and 15 years of service:

If we assume a uniform allocation of payroll between 3 and 15 years of service, the average cost for this group is a simple average of the above numbers, or 4.9% of pay. However, as mentioned above, two further adjustments are needed to translate this figure to a cost as a percent of total employer payroll.
First, we observe that, outside of years 3-15, there is no floor cost (in fact, for non-vested terminations with fewer than three years of service, the employer ‘gains’ from non-vested forfeitures, which we are ignoring.) We believe a reasonably conservative assumption is that 60% of total payroll applies to employees with 3-15 years of service.
Secondly, we don’t expect all employees to terminate employment in connection with a floor event, although we do recognize that these events are generally associated with a poor stock market which, in turn, may be associated with higher turnover. Accounting for this phenomenon, we believe an assumed employee turnover rate of 50% among employees with floor events is reasonably conservative.
Applying these adjustments to the average cost for our 3-15 year group produces the overall impact on payroll of 1.5% [4.9% x 60% x 50%] for our worst case year.
* * *
The foregoing is a stylized analysis. The individual events modeled are historically accurate, but the pattern of potential outcomes (high probability of no impact with a tail risk of declining probability but increasing impact) is impossible to represent with a single number. So, while it is tempting to boil the risk down to a single number, the detail provided on the exhibits provides a richer characterization of the cost and risk.
Sensitivity to workforce demographics
As mentioned, in translating individual events to employer costs, we have made several assumptions that we think are reasonably conservative for most employers, but results will vary somewhat based on different workforce characteristics.
For example, a large retailer with high turnover and low average service will probably face a greater floor risk than an oil company with lots of long-tenured employees. However, the retailer may also see offsetting savings from employees who terminate with fewer than three years of service who aren’t vested.
Historical market performance
Finally, as they say, past performance is no guarantee of future performance. For the 64 years between 1950 and 2013, the S&P 500 enjoyed a compound growth rate (CAGR) of more than 11%. Many people feel that future prospects are more modest.
On the other hand, one of the benefits of a long horizon of data is that it covers a lot of different environments. During the 1960s, the S&P 500 CAGR was 7.7%, in the 1970s the CAGR was 5.8%, and in the most recent decade the CAGR was -1.0%. All of this experience is captured and reflected in our analysis.
As far as bond returns, these are largely a function of interest rates. The historical period we have used covers a full 60-year interest cycle: low rates in 1950, generally increasing for three decades up to 1981, then generally declining to historic lows at the end of 2012.
In all probability, the next 20 years will not look like the last 20 years. For bonds, this is a virtual certainty, and closer to a statement of mathematics than an economic prediction.
The experience of the 1960s may provide a closer approximation of the risks in the years ahead. In particular, the floor event years of 1969 and 1974, years that saw a combination of poor stock market performance and higher interest rates, may be more realistic in the years ahead. Since rising interest rates reduce the return on bonds, a bond-heavy portfolio in such an environment might present a greater (albeit very small) floor risk than a diversified portfolio, as can be seen from the 1969 experience in Table 1.
* * *
Our purpose in providing this analysis is not to predict future risk. Indeed, risk is, by definition, that which is unknown. The numbers do, however, give some feel for how, and by how much, the capital preservation floor might push a nominal 5% of pay ReDB® promise ‘off track’ and the effect of asset allocation decisions and workforce characteristics on that risk.
In our next and last article in this series we will discuss how a sponsor might consider this analysis in making a decision whether to adopt a ReDB® plan and how that plan and its asset allocation might be designed.
