Brexit and DB Plans

The vote by the United Kingdom to exit the European Union (Brexit) on June 24th has created a lot of turmoil in financial markets. In this article we briefly discuss its possible effect on defined benefit plans.
Brexit and interest rates
For all critical purposes – minimum funding, accounting, PBGC variable-rate premiums and lump sum valuation (which affects the cost of de-risking) – DB plan benefits are valued based on the rates on high-quality US corporate bonds.
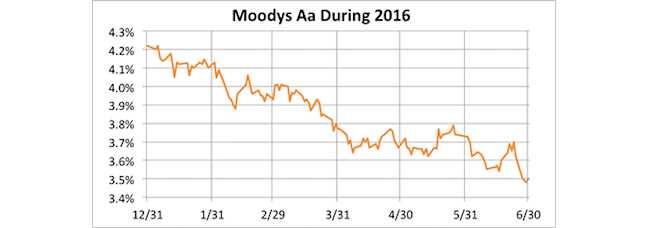
We are still finding out what effect Brexit will have on US corporate bond yields. It’s fair to say that it will drive yields down – indeed it already has. But it’s unclear by how much. The downward trend in bond yields since the beginning of the year may be more significant than the effect of Brexit itself, although we don’t really know at this point. The chart below shows Moody’s Daily Long-term Aa Corporate Bond Yield Average for the year, through June 30, 2016.

Source: Moodys.com website
The Moody’s Long-term Aa yield is down 0.72% for the year (3.50% as of June 30th). Since the (pre-Brexit) close on June 23rd, the yield is down 0.20%, so almost 30% of the total decline this year has come since Brexit.
The decline in interest rates this year have increased pension liabilities 10%-15% above their level if rates were unchanged – plan sponsors with ‘longer duration’ liabilities are seeing the biggest increases.
We also note that there is widespread speculation that as a result of Brexit the Federal Reserve will put possible 2016 increases in interest rates on hold. In any case, it appears, as the above chart indicates, that the Fed short-term rate increase last December has had the effect of lowering (rather than raising) medium- and long-term rates, a possibility we discussed at the time.
Brexit and stocks
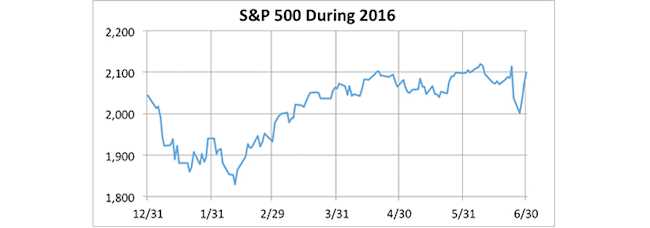
The impact of Brexit has not been confined to the bond market – stocks are also seeing significant volatility. Below is a graph of the S&P 500 index during 2016:

Source: Yahoo.com
Here we also see a big drop – more than 5% – in the two days following Brexit, but this has been largely reversed, with stocks rebounding almost 5% in the last three days of the month. Overall, the S&P 500 is down almost 1% since Brexit, but is actually up more than 3% (including dividends) for the year.
A closer look
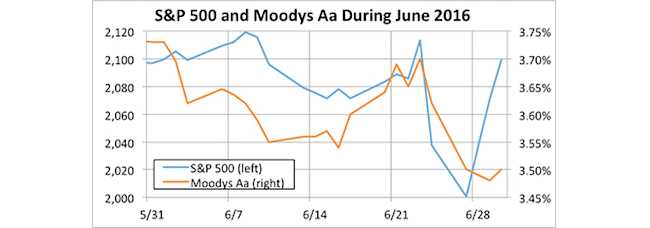
The chart below zooms on in the month of June, looking at both stock prices and interest rates:

This gives us a more granular view of recent events. Note that both stocks and interest rates rallied strongly in the days leading up to Brexit, presumably in anticipation of a ‘Remain’ vote.
The movement in interest rates is much more pronounced than stocks, suggesting that this variable is much more sensitive to the Brexit vote than stock prices. And while stocks have rebounded sharply in the past three days, interest rates continue to drift toward all-time lows.
Effect on DB plans
Currently, DB minimum funding requirements are determined based on a ‘floor rate’ of 90% of a 25-year average of interest rates. The Bipartisan Budget Act of 2015 (BBA), signed into law by President Obama in November of 2015, extended that 90%-of-the-25-year-average floor three years: it was supposed to begin phasing down in 2018; under BBA 2015 it will not begin phasing down until 2021.
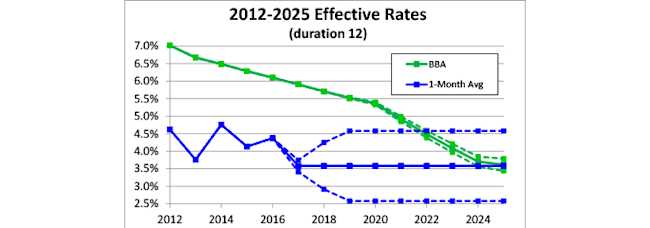
The graph below illustrates the ‘effective interest rate’ for a typical pension plan under BBA, including estimates of future rates assuming interest rates either rise or fall 1% from current levels over the next two years. Rates are shown under BBA (green), along with ‘market’ 1-month average rates (blue).

Source: Internal Revenue Service, October Three calculations
Because BBA rates are 25-year averages, they are quite stable in the face of volatile market rates. As the graph above suggests, BBA rates will likely control pension funding calculations through 2021 at least, and as late as 2024 if rates remain at their current levels.
In contrast, the calculation of the value of liabilities for purposes of financial disclosure, PBGC variable-rate premiums and lump sums is generally made using current market interest rates, approximated by the blue line.
Valuation rate doublethink
Thus, a DB plan sponsor is faced with a disjunction between the valuation interest rates it is allowed to use for purposes of ERISA minimum funding, on the one hand, and the rates it must use for pretty much everything else, on the other. To get a feel for how extreme this disjunction is, consider the following table comparing the minimum funding valuation rate (applying the 90%-of-the-25-year-average floor) for 2016 with market segment rates for May 2016.
First segment | Second segment | Third segment | |
Minimum funding (90%-of-the-25-year-average floor) | 4.43% | 5.91% | 6.65% |
Market (as of May 2016) | 1.50% | 3.60% | 4.62% |
Spread (between minimum funding rate and market rate) | 2.93% | 2.31% | 2.03% |
Source: Internal Revenue Service
To repeat: the market rates in this table (the latest we have from IRS) are from May 2016; Brexit-related interest rate decreases will only increase this spread.
Different types of sponsors – different concerns
Cash-sensitive DB sponsors are generally protected from swings in market interest rates by the ERISA minimum funding interest rate stabilization rules. For them, the fallout from Brexit is generally irrelevant (except for its effect on PBGC premiums, discussed below).
Earnings-sensitive sponsors are not. Market interest rates were, pre-Brexit, already significantly down for the year. Brexit has driven them down further. If these lower rates continue to year end, liabilities for financial disclosure purposes will increase significantly.
Sponsors of plans with unfunded vested benefits (UVBs) must pay PBGC variable-rate premiums, generally determined as a (seemingly ever-increasing) percentage of the plan’s UVBs. (In this regard, see our article PBGC premium increases: significance for funding, de-risking & plan termination.) UVBs are also valued using market interest rates. Pre- and post-Brexit decreases in interest rates, if they persist to year end, will increase the value of UVBs and thus increase PBGC variable-rate premiums (provided they are not affected by the variable premium cap). We have written extensively about tactics for reducing PBGC variable-rate premiums, including borrowing-and-funding and de-risking.
And, if interest rates continue at their current (lower) levels, then the cost of de-risking in 2017 is likely to be higher than in 2016. That’s because many companies peg lump sum valuation rates at the end of the prior year; thus lump sum valuation rates for 2016 are based on end-of 2015 interest rates; those rates were considerably higher than current rates.
* * *
It appears that the DB finance story for 2016 will be driven by increases in liabilities due to lower interest rates and (perhaps) marginal underperformance on assets. These interest rate ‘losses’ may be mostly a function of long term trends, but these trends have been exacerbated by Brexit.
Do you have needs in the UK or around the globe? See how our international consulting services can help.
