Accounting impact of changes in interest rate and mortality assumptions
Two major factors affecting defined benefit plan finance are interest rate and mortality assumptions. We expect significant changes to both these factors in the coming years. Federal Reserve Chair Janet Yellen has indicated that the Fed expects to increase short-term interest rates later this year. Interest rate relief under Highway and Transportation Funding Act of 2014 (HATFA) is ‘phasing down.’ And the Society of Actuaries has published new mortality tables (RP-2014) and a new mortality improvement scale (MP-2014) that, when adopted, will increase participants’ assumed life expectancies across the board.
In this article we consider the possible effect of these changes on sponsor financial statements. In subsequent articles, we will discuss the effect on ERISA minimum funding requirements and the cost of de-risking transactions.
Our intention is not to make predictions but rather to give sponsors a feel for how the relevant numbers – specifically, the value of plan liabilities – may change under different assumptions.
Interest rates – generally
Much of the discussion of Fed policy has focused on a possible increase in short term rates. In testimony before Congress, Fed Chair Yellen discussed increasing the federal funds rate. Most DB plan liabilities are, however, not ‘short term,’ at least not as short term as the fed funds rate (which is an overnight rate). Thus the effect on DB plan finance of a Fed-driven increase in short term rates will depend on how it affects changes in rates across the yield curve. With respect to that issue, different analysts have different views: some, for instance, believe that, by dampening inflation expectations, an increase in short term rates may lead to a decrease in long term rates.
Moreover, observers point to factors besides Fed policy that may affect interest rates, including the economic outlook and international economic and political developments. In this regard, we note that medium- and long-term interest rates (as of July 31, 2015) are currently up almost around 25 basis points vs. the beginning of the year.
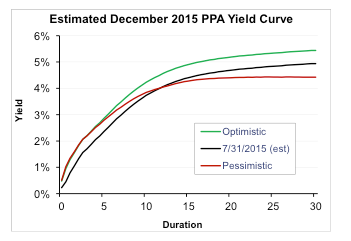
We consider the effect of possible interest rate increases on sponsor financial statements by analyzing two different scenarios (out of a nearly infinite number of possible ones):
Optimistic: The Fed raises short-term rates by 50 basis points between now and the end of the year, and that results in a 50 basis point increase in rates across the yield curve. (We call this ‘optimistic’ because of its affect on DB plan finance – higher interest rates = lower liabilities.)
Pessimistic: The Fed raises short-term rates by 50 basis points; medium-term rates are unchanged and long-term rates go down 50 basis points.
The following chart illustrates these two scenarios vs. current rates.
Chart 1 – Yield curve – current rate and optimistic and pessimistic scenarios

Effect on accounting
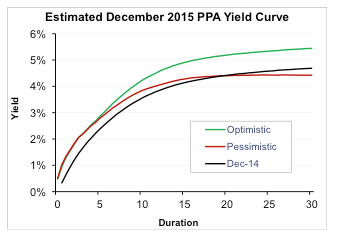
Of course, for accounting what matters is the change in rates from the last measurement date, e.g., December 31, 2015 vs. December 31, 2014. The chart below presents the same 2015 yield curve changes relative to rates for December 2014.
Chart 2 – Yield curve – December 2014 rates and 2015 optimistic and pessimistic scenarios

(All our calculations are done based on IRS-reported Pension Protection Act (PPA) liability valuation interest rates. Those rates produce a decent approximation of a yield curve used for GAAP reporting.)
Interest rate-driven change in liabilities – shorter duration and longer duration plans
We consider the effect of changes in rates on two different types of plans: a shorter duration (9 years) plan; and a longer duration (15 years) plan.
The following table shows the 2015 effect – the change in plan liabilities vs. liabilities calculated based on December 31, 2014 rates – under our two different interest rate scenarios (optimistic/pessimistic).
Table 1 – Interest rate-driven change in liabilities for accounting, based on December 31, 2015 vs. December 31, 2014 rates
Shorter duration plan
Change in liabilities | |
Optimistic | - 6% |
Pessimistic | - 1% |
Longer duration plan
Change in liabilities | |
Optimistic | - 11% |
Pessimistic | 0% |
These numbers tell a fairly straightforward story – interest rates at maturities up to at least 15 years are higher under our scenarios than they were at the end of 2014, reducing pension liabilities for most sponsors. Under a pessimistic ‘flattening yield curve’ scenario, much of this reduction could be cancelled by the impact of lower long-term rates, particularly for the longer duration plan.
Mortality assumptions – generally
As a preliminary matter, let’s note that the following analysis holds for traditional DB plan liabilities. Mortality is less significant for, and will have less of on effect on, cash balance plan liabilities. The effect will also be less significant for a ‘traditional’ DB plan that typically pays out lump sums, because the plan accumulates fewer participants over age 65.
Sponsors, in consultation with their auditors, will determine if and when the new SOA 2014 tables/improvement scale will be adopted for financial statement disclosure. As we understand it, many auditors are urging sponsors to consider adopting the new mortality assumptions for 2015 (some sponsors have already adopted a new mortality assumption at the end of 2014).
The new tables/improvement scale have been controversial. Some sponsors will want to consider ‘customizing’ the rates (e.g. blue/white collar). To keep things simple, for purposes of this article, we are going to assume that the RP-2014/MP-2014 Table is adopted ‘as is.’
Let’s begin our analysis with some numbers from the SOA estimating the effect of adoption of the new mortality assumptions on liabilities at different ages. (These numbers were calculated by the SOA for minimum funding purposes assuming adoption of the RP-2014 mortality tables/improvement scale by IRS for 2016.)
Table 2 – Increase in liabilities at different ages resulting from adoption of new mortality assumptions
Age | ||
Males | 25 | 9.8% |
35 | 7.9% | |
45 | 5.4% | |
55 | 3.6% | |
65 | 4.5% | |
75 | 9.8% | |
85 | 16.9% | |
Females | 25 | 11.8% |
35 | 10.3% | |
45 | 8.3% | |
55 | 6.6% | |
65 | 5.8% | |
75 | 8.0% | |
85 | 10.7% |
Before we translate these numbers into an ‘increase in liabilities’ for our shorter and longer duration plans, let’s take a moment to consider the pattern of the longevity increase numbers in this table. There is, in effect, a ‘saddle’ – longevity increases are highest for the very young and the very old, and lowest for 45-65 year olds. Thus, for a given plan, the magnitude of the impact of the new mortality assumptions may often depend on how many 45-65 year olds vs. how many 25-35 and 75-85 year olds are in the plan’s participant demographic.
Mortality-driven increase in liabilities – shorter and longer duration plans
That said, assuming a (relatively) ‘even’ demographic distribution, the new mortality assumptions will have a greater effect on shorter duration plans, because of the significant life expectancy increases at ages 75 and 85. Here is our estimate of the net increase in plan liabilities for our shorter duration and longer duration example plans on a GAAP basis at 12/31/2015. (These numbers are slightly elevated compared to the figures in Table 1, since current GAAP discount rates are lower than the rates used to develop Table 1)
Table 3 – Increase in plan liabilities resulting from mortality assumption changes
Shorter duration plan | 10% |
Longer duration plan | 8% |
Combined effect of changes in interest rate and mortality assumptions
Now let’s consider the combined effect of interest rate and mortality assumption changes.
The following table shows changes in liabilities for 2015 accounting due to the combination of changes in interest rates (under optimistic and pessimistic scenarios) and mortality assumptions for our shorter duration and longer duration example plans. (Because of rounding and compounding, the result is not simply a matter of adding together the effect of standalone changes in interest rate and mortality assumptions.)
Table 4 – Change in liabilities at December 31, 2015 due to changes in interest rate and mortality assumptions
Shorter duration plan
Optimistic | 3% |
Pessimistic | 8% |
Longer duration plan
Optimistic | - 3% |
Pessimistic | 8% |
For 2015, changes in interest rates under our scenarios generally reduce liabilities, while adoption of the new mortality assumptions is likely to increase liabilities. For the longer duration plan, under the optimistic scenario, the change in interest rates more than offsets the effect of the new mortality table. In the other cases, net liabilities increase. That increase may be immaterial to some and more significant to others, but is not likely to be catastrophic.
Effect on income statement
We have only looked at the affect of changes in interest rate and mortality assumptions on the calculation of liabilities at the end of 2015. For accounting, those liability changes will show up on the balance sheet immediately. Those liabilities will work their way into the income statement beginning in 2016 pursuant to an elaborate set of recognition rules. (We discuss those rules in detail in our article Accounting for pensions: very much under construction.)
* * *
In our next article in this series we will discuss the effect of changes in interest rate and mortality assumptions on plan funding.
