June 2020 Pension Finance Update
June was another positive month for pension finance, rounding out a solid quarter during which plans clawed back about one-third of the ‘hole’ created in the first quarter. Both model plans we track[1] gained ground last month, with Plan A improving more than 1% and plan B up less than 1% during June. For the year, Plan A is down 8% and Plan B is down 2% through the first two quarters of 2020:

Assets
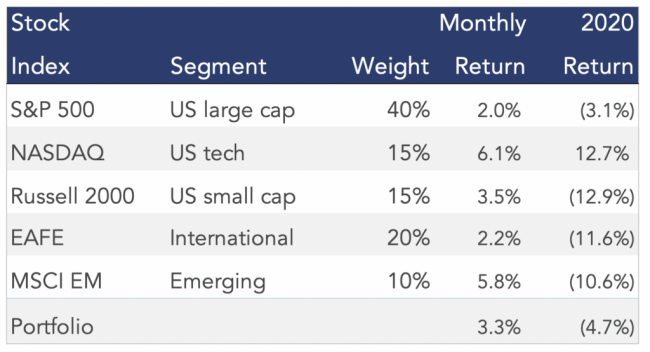
Stocks posted a third consecutive positive month in June. A diversified stock portfolio, which lost more than 20% in the first quarter, ended June down less than 5% for the year.

Treasury rates were flat last month, while corporate yields edged lower less than 0.1%, as credit spreads continued to “normalize”. As a result, Treasuries gained a fraction of 1%, while corporate bonds added 1% in June. A diversified bond portfolio gained less than 1% last month and is now up about 9% through the first two quarters of 2020, with long duration and Treasuries outperforming.
Overall, our traditional 60/40 portfolio gained 2% in June and is now (barely) in the black for the year, up less than 1%, while the conservative 20/80 gained less than 1% last month and is now up 5% through the first two quarters of 2020.
Liabilities
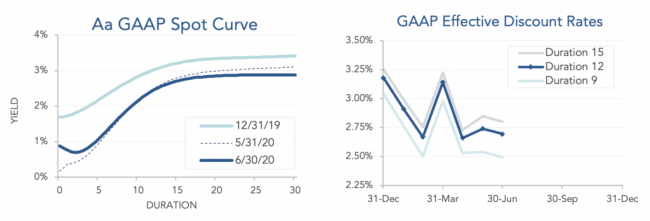
Pension liabilities (for funding, accounting, and de-risking purposes) are driven by market interest rates. The first graph below compares our Aa GAAP spot yield curve at December 31, 2019 and June 30, 2020, and it also shows the movement in the curve last month. The second graph below shows our estimate of movements in effective GAAP discount rates for pension obligations of various duration during 2020:

Corporate bond yields continue to move in record-low territory, pushing pension liabilities up this year. Through the first half of 2020, liabilities have increased 8%-11% for most plans, with long duration plans seeing the largest increases.
Summary
Given the background environment, the performance of pension plans in the second quarter of 2020 is nothing short of remarkable. At the end of March, all signs pointed to a catastrophic year. Three months later, we are by no means out of the woods, but finances have stabilized and improved to the point that 2020 now looks merely like a ‘bad’ year. The graphs below show the movement of assets and liabilities during the first two quarters of 2020:

Looking Ahead
Pension funding relief has reduced required plan funding since 2012, but under current law, this relief will gradually sunset. Given the current level of market interest rates, it is possible that relief reduces the funding burden through 2030, but the rates used to measure liabilities will move significantly lower over the next few years, increasing funding requirements for pension sponsors that have only made required contributions.
2020 experience, if it persists, will not increase required contributions until 2022, compounding higher funding requirements due to the fading of funding relief. There is a reasonable chance we get more relief this year, but at this point it’s too soon to say for certain.
Discount rates moved slightly lower last month. We expect most pension sponsors will use effective discount rates in the 2.4%-2.8% range to measure pension liabilities right now.
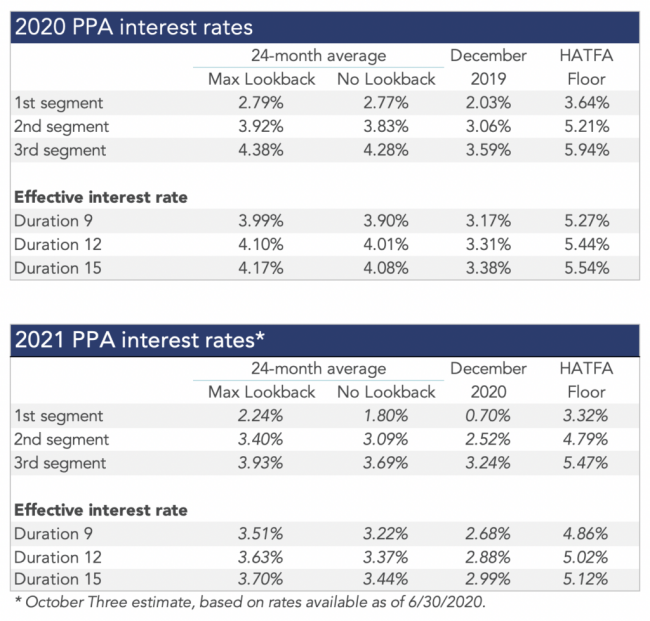
The table below summarizes rates that plan sponsors are required to use for IRS funding purposes for 2020, along with estimates for 2021. Pre-relief, both 24-month averages and December ‘spot’ rates, which are still required for some calculations, such as PBGC premiums, are also included.

[1] Plan A is a traditional plan (duration 12 at 5.5%) with a 60/40 asset allocation, while Plan B is a largely retired plan (duration 9 at 5.5%) with a 20/80 allocation with a greater emphasis on corporate and long-duration bonds. We assume overhead expenses of 1% of plan assets per year, and we assume the plans are 100% funded at the beginning of the year and ignore benefit accruals, contributions, and benefit payments in order to isolate the financial performance of plan assets versus liabilities.
